Storm’s meteorological conditions
import act
import numpy as np
import xarray as xr
import math
import pandas as pd
import matplotlib.pyplot as plt
from metpy.calc import cape_cin, dewpoint_from_relative_humidity, parcel_profile
from metpy.units import units
import metpy.calc as mpcalc
import hvplot.xarray
import holoviews as hv
hv.extension('bokeh')
# Set your username and token here!
username = 'YourUser'
token = 'YourToken'

# Set the datastreams
datastream = 'cormetM1.b1'

# start/enddates
startdate = '2019-01-29'
enddate = '2019-01-29'

# Use ACT to easily download the data.  Watch for the data citation!  Show some support
# for ARM's instrument experts and cite their data if you use it in a publication
result = act.discovery.download_arm_data(username, token, datastream, startdate, enddate)
[DOWNLOADING] cormetM1.b1.20190129.000000.cdf

If you use these data to prepare a publication, please cite:

Kyrouac, J., Shi, Y., & Tuftedal, M. Surface Meteorological Instrumentation
(MET). Atmospheric Radiation Measurement (ARM) User Facility.
https://doi.org/10.5439/1786358
# Let's read in the data using ACT and check out the data
ds_met = act.io.read_arm_netcdf(result)

# First, for many of the ACT QC features, we need to get the dataset more to CF standard and that
# involves cleaning up some of the attributes and ways that ARM has historically handled QC
ds_met.clean.cleanup()
dewpoint = mpcalc.dewpoint_from_relative_humidity(
    ds_met.temp_mean,
    ds_met.rh_mean
)

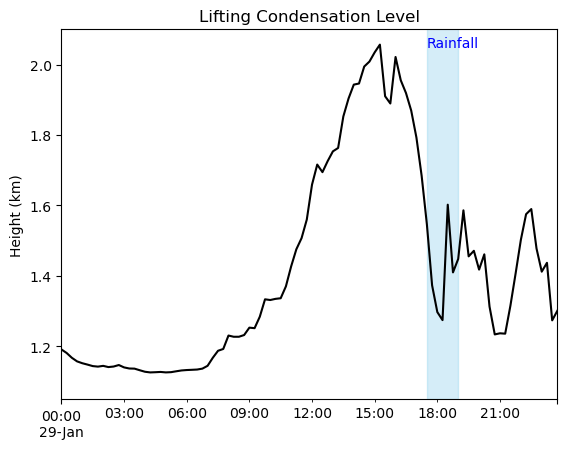
lcl_pres, lcl_temp = mpcalc.lcl(ds_met.atmos_pressure, ds_met.temp_mean, dewpoint)
lcl_height = mpcalc.pressure_to_height_std(lcl_pres)
pd.DataFrame(lcl_height, ds_met.time).resample('15T').mean().plot(legend = False, c = 'k',)
plt.ylabel('Height (km)')
plt.title('Lifting Condensation Level')
plt.text('2019-01-29 17:30', 2.05, 'Rainfall', color = 'blue')
plt.fill_betweenx(y = np.arange(1.05, 2.2, 0.1),
                  x1 = '2019-01-29 17:30',
                  x2 = '2019-01-29 19',
                  color = 'skyblue',
                  alpha = 0.35)
plt.ylim(1.05, 2.1)
/tmp/ipykernel_25274/2585072646.py:1: FutureWarning: 'T' is deprecated and will be removed in a future version, please use 'min' instead.
  pd.DataFrame(lcl_height, ds_met.time).resample('15T').mean().plot(legend = False, c = 'k',)
(1.05, 2.1)

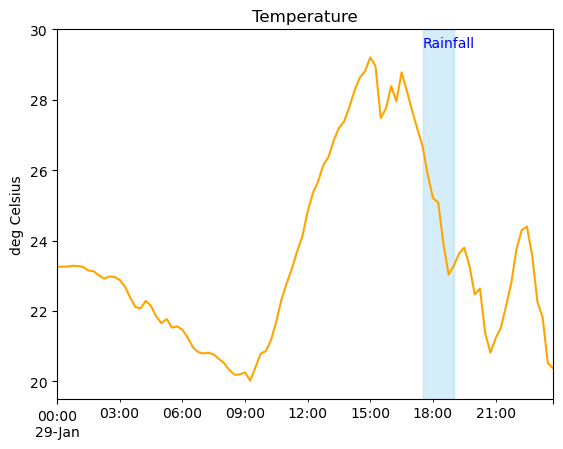
pd.DataFrame(ds_met.temp_mean, ds_met.time).resample('15T').mean().plot(legend = False, c = 'orange')
plt.ylabel('deg Celsius')
plt.title('Temperature')
plt.text('2019-01-29 17:30', 29.5, 'Rainfall', color = 'blue')
plt.fill_betweenx(y = np.arange(19, 31, 1),
                  x1 = '2019-01-29 17:30',
                  x2 = '2019-01-29 19',
                  color = 'skyblue',
                  alpha = 0.35)
plt.ylim(19.5, 30)
/tmp/ipykernel_25274/2549148853.py:1: FutureWarning: 'T' is deprecated and will be removed in a future version, please use 'min' instead.
  pd.DataFrame(ds_met.temp_mean, ds_met.time).resample('15T').mean().plot(legend = False, c = 'orange')
(19.5, 30.0)

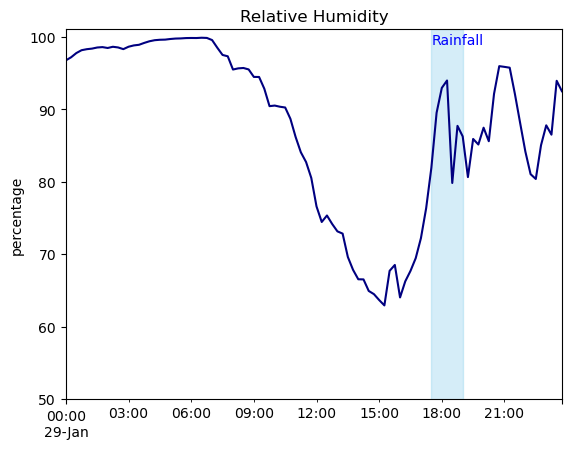
pd.DataFrame(ds_met.rh_mean, ds_met.time).resample('15T').mean().plot(legend = False, c = 'navy')
plt.ylabel('percentage')
plt.title('Relative Humidity')
plt.text('2019-01-29 17:30', 99, 'Rainfall', color = 'blue')
plt.fill_betweenx(y = np.arange(30, 102, 1),
                  x1 = '2019-01-29 17:30',
                  x2 = '2019-01-29 19',
                  color = 'skyblue',
                  alpha = 0.35)
plt.ylim(50, 101)
/tmp/ipykernel_25274/213394467.py:1: FutureWarning: 'T' is deprecated and will be removed in a future version, please use 'min' instead.
  pd.DataFrame(ds_met.rh_mean, ds_met.time).resample('15T').mean().plot(legend = False, c = 'navy')
(50.0, 101.0)


